
Current Cost CC128 Envi Review

Overview
A home automation article popped up in my RSS feed and lead me to this cool device. It’s a combination of a display and sensor which allows you to monitor and track the amount of electricity is being used to the property. The manufacture, Current Cost makes and sells these devices themselves as well as selling them as a white label item to be re-branded.
There are 2 versions of the Current Cost device. One named the classic was their first incarnation and the current CC128 or “Envi” is their newest version.

Sensor
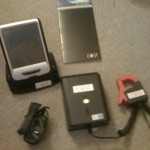
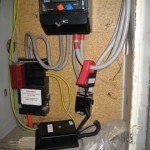
Unlike traditional sensors this one does not need to be wired up. I’m not sure how it knows how much electricity is being consumed but it as far as I’m aware it works. The sensor and display uses wireless technology to pair the two together. The sensor has an over sized clip which goes AROUND the fat electric cable going into the home. The sensor sends data back every 6 seconds to the display unit.
Display

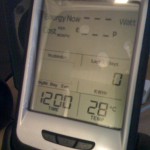
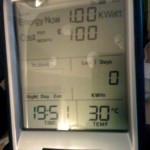
The display has a large LCD display using pigments to display the number and static letters which do not change (only turned on and off to hide and unhide the text). It’s nice and large characters makes it easy to read. Similar to a mobile phone it has a signal bar showing the strength between the sensor and the display, a status icon to show it’s picking up electricity from the sensor and the Current Cost Logo.
The next line down shows the current electricity being used in Watts and Kilo Watts. This figure updates every 6 seconds. The line below is the cost based on the current usage. This can be set to standard rate or off and on peak times. It currently does not allow more than 1 off and 1 peak time configuration. From an email to Current Cost, the cost per day / month should only be used as an guideline as oppose to an absolute value that will appear on the bill. The currency can be changed from £ (pounds) to € (Euros).
The middle row shows a graph of usage in bars. This is broken down by night, day and evening times. The value shown to the right is the number of Kilo Watt Hours usage for the last 1, 7 and 30 days. This rotates every 10 seconds.
The last line shows the current time and the temperature. The temperature sensor is built into the display and not the electricity sensor.

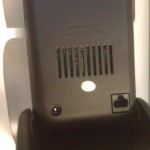
The display stores historical data and there is a RJ45 at the back which is used to connect to the PC. The RJ45 to USB cable is sold separately.
Usage

One of the first thing to do is set the time up. This will be used to calculate the graph. Then pairing the sensor to the display. The display can support up to 3 sensors or 9 individual application monitors which are not currently available yet. Once paired the sensor can be put into the cabinet. In my case there were several thick cables and it was the second try that I got the correct one.
Data Capture
The RJ45 to USB cable uses a USB to serial type similar to one used for Arduinos. It’s a simple way of using a USB connector for a serial device. The problem I had with the USB to serial drivers kept BSOD’ing my Windows 7 64 bit. Whilst the website says they are Vista compatible I do not think they are 64 bit compatible. After a reboot I quickly un-installed it but not before using the CurrentCost GUI software.
It wasn’t bad for the brief few minutes I got to use it. The look was very raw but did the job. The live graph worked and I dared it to download the historical data which was were it crashed my computer.
I have it plugged into the Linux computer, installed “Serial port terminal” and managed to get the XML that is sent down the cable. I intend to write a program to capture and log these messages but that’s for a future topic if I can get it working.
Summary
I am concerned that there is a 7 Year shelf/battery life on the product but 7 years is a long time away. Hopefully by then there would be newer better versions out. It is a very useful indication of how much electricity things around the home uses. Using the statistics to determine which electricity tariff is the best is a good idea as well as seeing the effect of actually turn things off. Overall a very good product but I would like to see the data cable to be included with the device.
Pingback: Danny Tsang » Blog Archive » Recording CurrentCost Data & Viewing It On The Web